One of the most complex things my team is asked to study is customer purchasing patterns. With all the data that exists, it may seem strange that I think this is complex. And yet I picked that word deliberately. It’s not that we have a lack of data to help understand who purchases Dun & Bradstreet products, how often they buy, and what products they buy: We’re a data company – of course we know that. Where the complexity lies is trying to understand why they buy us and why they choose to stay, or renew, with us.
At most companies, it is often simpler to start with opportunity analytics (see my prior article How Analytics Can Help Sales Teams Close More Deals). However, maximum impact for a company like Dun & Bradstreet really comes from understanding how to improve customer retention rates. And to do this, we need to understand which customers are at risk of leaving us and why.
I’m passionate about ensuring that my team has a 360-degree view of our customers, and I have both internal analytics and customer insights/research within my team. It’s not the typical setup – I specifically requested this, because I truly believe that actionable insights come from bridging all sources of data.
Many B2B companies lean heavily on financial data and firmographics to study client retention patterns – profiling patterns across industries and company sizes. And that’s absolutely a great place to start. However, it’s like writing with a marker when you really need a ball point pen – that data is foundational, but usage data, survey data, contract details, company financial scores, etc. can help you really understand what is driving attrition. For example, you might see that large technology companies tend to have higher retention rates and therefore not focus on them for retention efforts.
The next quarter, you may see quite a few of those companies leave. So what went wrong? Back to my earlier point: Studying customer purchasing patterns is very complex, and isolating the critical factors to manage risk proactively is the golden ticket.
Further, it’s not only the building of but also the adoption of customer retention analytics that can make them challenging. Our journey is unique in that we started building retention risk models early on, but they weren’t being leveraged. So that’s when we shifted to propensity modeling and demand estimators, which were quickly adopted in marketing and sales. The turning point came when there was a downturn in our retention performance in combination with a cultural focus on customer experience.
So my team began to deeply study customer retention and made the decision to build more retention risk models to cover all of our lines of business – prioritizing those that were showing the biggest erosion. And we had both the appetite for our increased effort and partnership from our national sales team, which gave us the confidence that our work would have impact. In fact, with the sponsorship of our head of national sales, we created a process with sales operations that generated an “at risk” account list based on analytics six months prior to renewal. From there, the respective sales executives would refine and finalize the list, a beautiful combination of analytics and field knowledge. These accounts then had targeted action plans put against them to prevent churn.
“By partnering with analytics, we are able to take both the art and the science and combine them to get the best of both worlds. The analytics team is able to generate a view on risk that the sales team cannot and vice versa. When you combine the two, you are really able to put a laser focus on those accounts with the most risk,” says Kelly Stead, Leader of Sales Operations.
And fairly soon after we started this process, we saw double-digit increases in the retention rate of high-risk accounts!
“There are two levers to drive revenue: retention and new business. It sounds simple to only have to focus on two levers; however, we all know there are many variables that impact retention and new business. Working with the analytics team to analyze all the variables that impact retention and come up with a simple score for the sales team to interpret (high, medium, low) was the perfect way to provide my team an analytically driven measure of how to prioritize team resources and time. Successful sales teams must be surgical on where they spend their time and why. We have seen the improvement in our retention by providing a simple-to-interpret quantitative score on the assessment of risk with the qualitative knowledge of the selling teams,” says Carolyn Bancroft, SVP of North America National Sales.
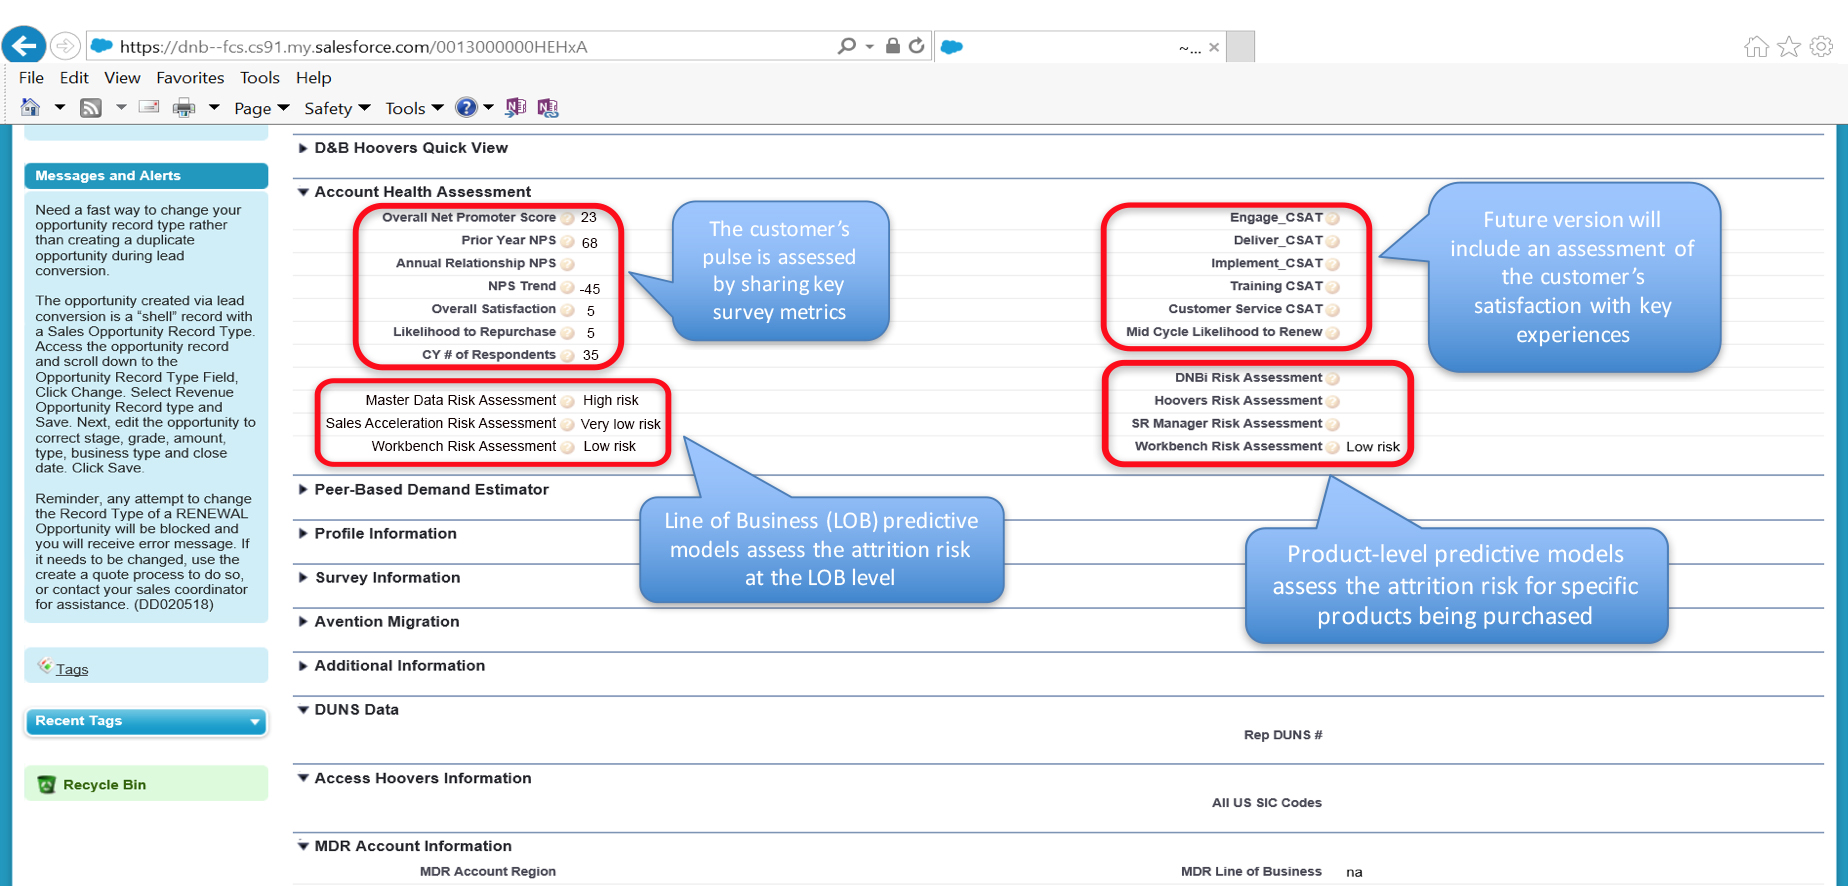
This success gave us the impetus to take these insights one step further to really drive consumption. Instead of running this process via files, we built the insights at the account-level into our CRM – both the retention model scores and the customer survey results.
This is a view of what a sales or customer support resource would see:

Although the CRM view just launched in February, we’re receiving incredible feedback from our front line, and the insight is driving action. This once again shows the recipe for success is best-in-class analytics + relationships + targeted applications. This time we’ve added modern channels to take consumption to the next level. And although it required deep cross-functional effort to build the analytics and insights into our CRM, early indications are showing it was well worth it.

